
Click image to enlarge
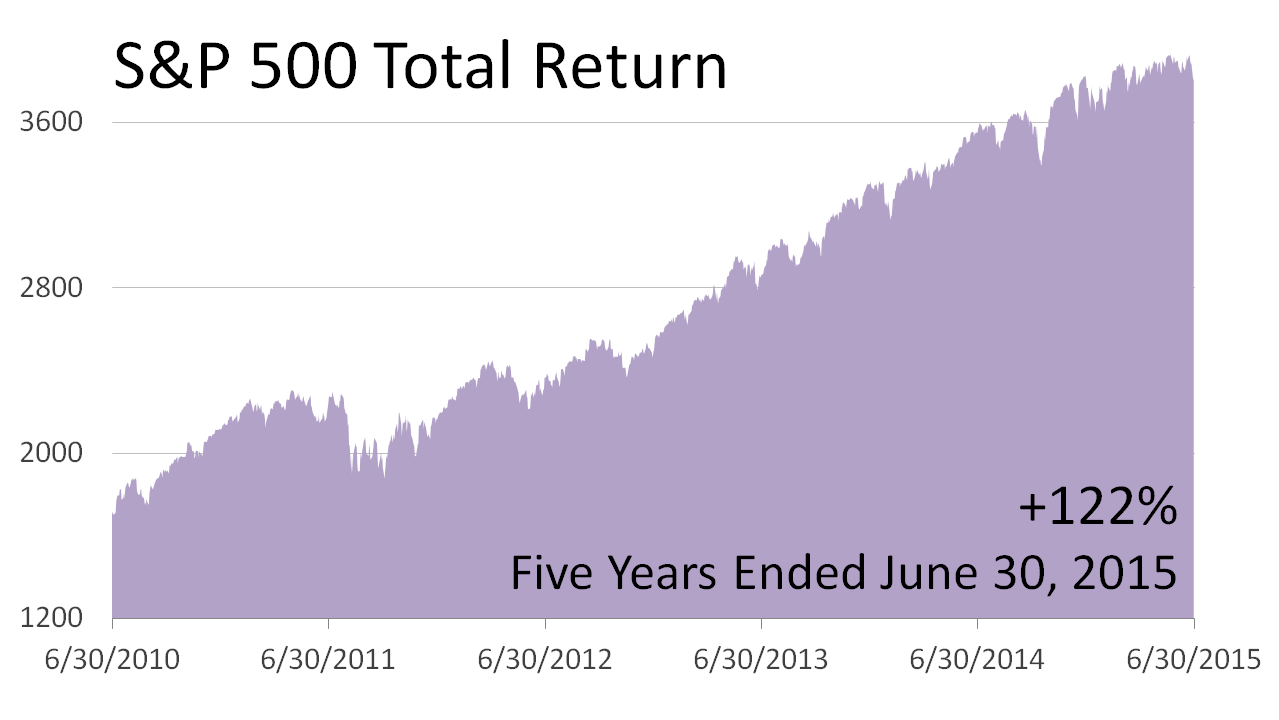
AGING BULL
Since 1900, only three of 23 bull runs lasted longer than the current 61/4-year run. The likelihood of a bear market - a correction of at least 20% - increases as the bull ages. But economic conditions preceding bear markets in the past were not present at the start of 3Q2015.
Click image to enlarge
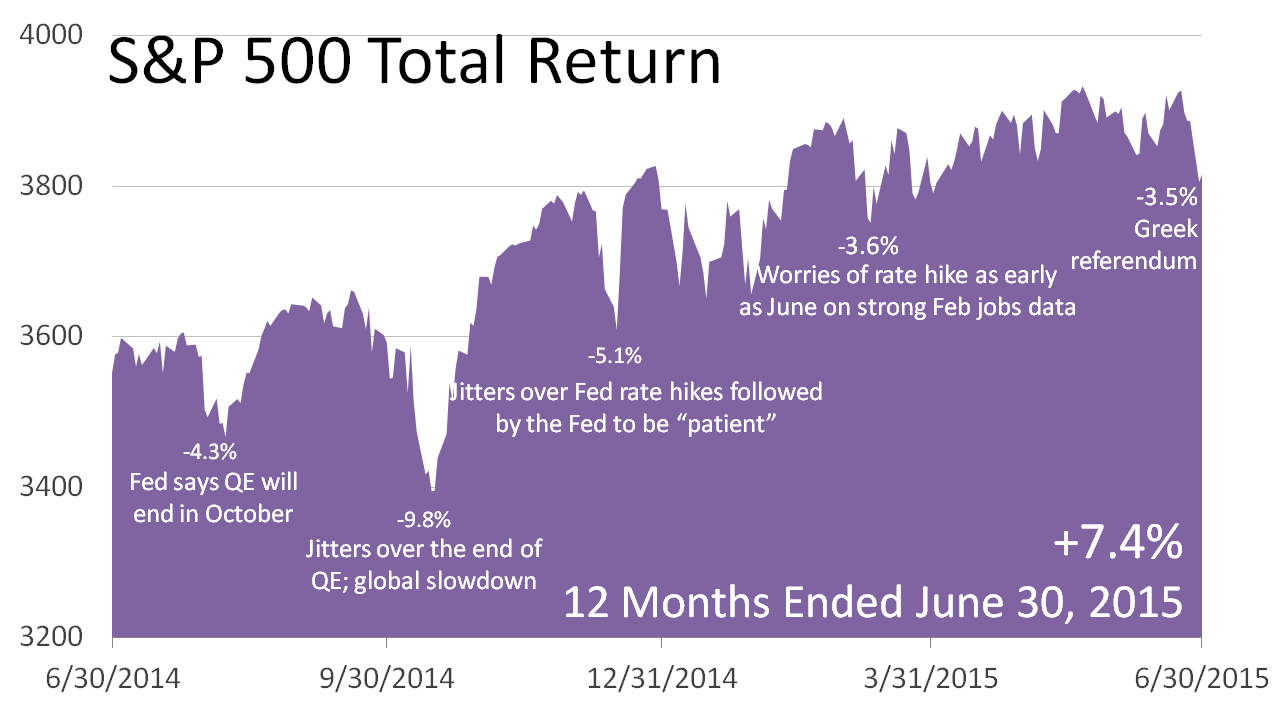
RATE SPOOKS
Most of the year's stock-price dips were related to fears about the end of monetary stimulus by the Fed, which was implemented in October 2014, and then worries about when the first rate hike would come. Strengthening economic data trumped fears and drove stock prices.
Click image to enlarge
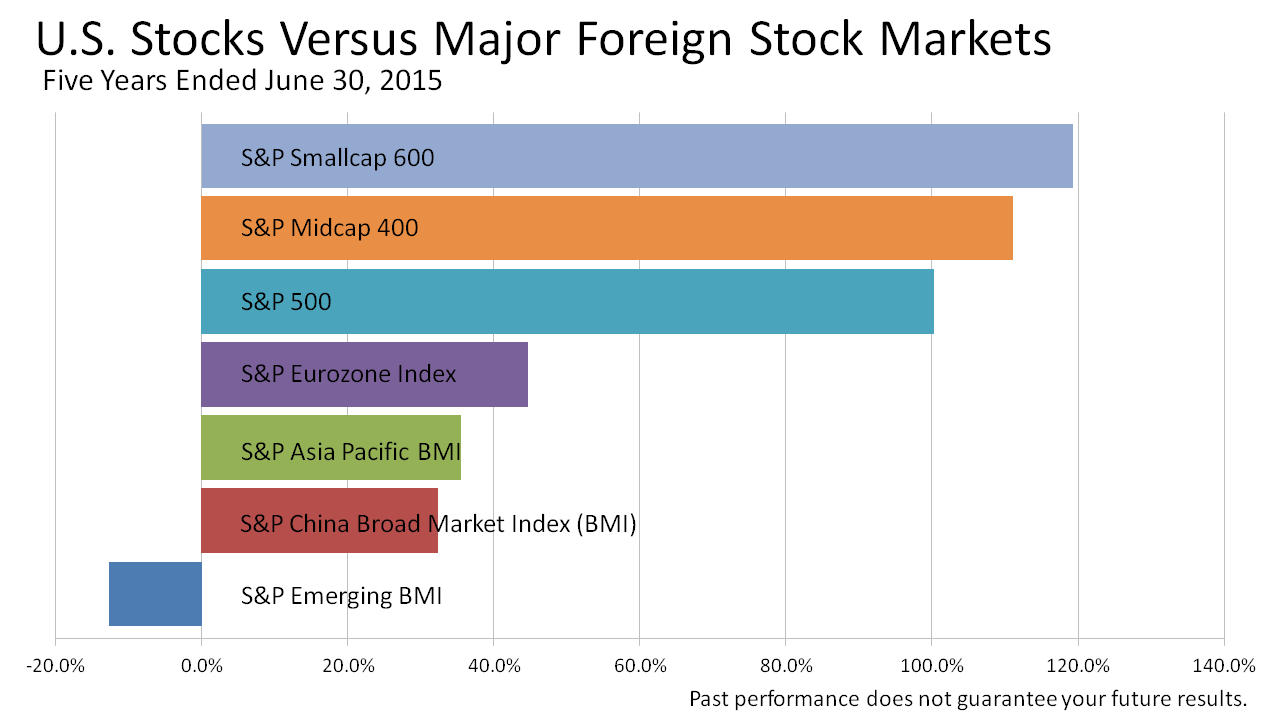
AMERICA, THE EXCEPTIONAL
The past five-years showed why America is great. The U.S. led the global recovery after the global crisis of 2008, The S&P 500 rose 122% versus 45% for Eurozone stocks, 36% on Asia Pacific issues, 32% on China, and a loss of 13 on Emerging Markets stocks.

Click image to enlarge
HEALTH CARE UP
Health care outperformed all major industry groups by a big margin for the 12 months. Consumer discretionary stocks had a strong quarter again, on strength in jobs. With crude oil's weakness, energy tanked for the third quarter in a row. Utilities have suffered on fears rates might rise sooner than expected.
Click image to enlarge
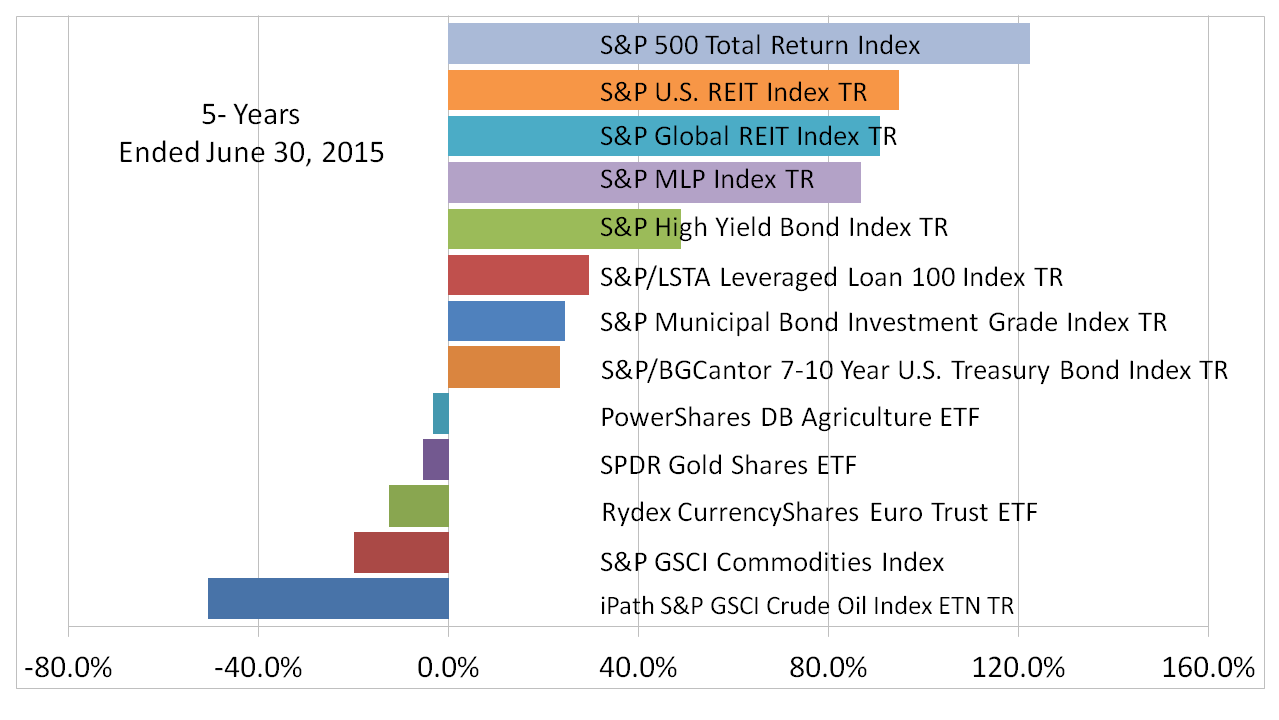
DIVERSITY WORKED
Across 13 asset classes over a five-year period -- a long time, the best investment by far was U.S stocks. The worst: crude oil and other commodities. The euro lost 13% versus the dollar; U.S. Treasurys returned 23% or 4.6% per year. Gold shot from about $1,200 an ounce to $1,800, settling recently at $1,120.
Click image to enlarge
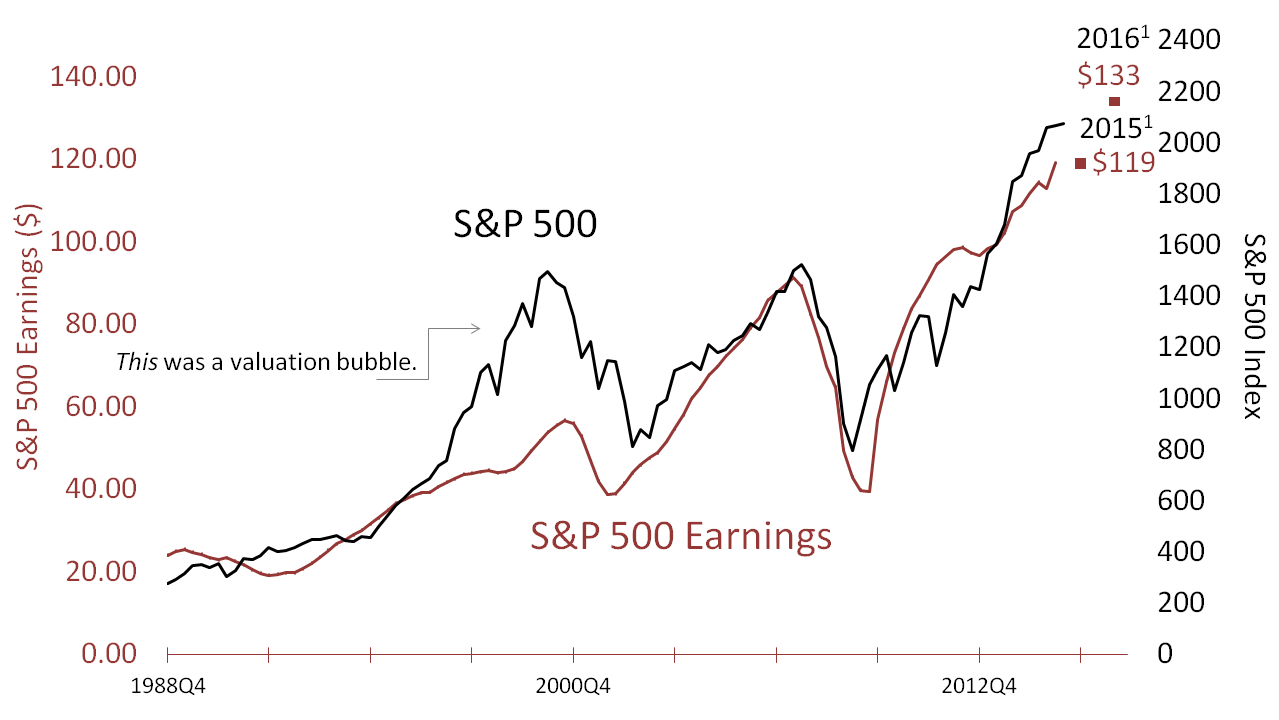
S&P 500 INDEX VS. EARNINGS
Red squares show expected earnings on the S&P 500 index based on a June 25 forecast by Wall Street analysts, for $119 per share in 2015 and $133 in 2016. The trajectory of earnings growth seems posed continue to propel stocks higher - unless a crisis or really bad unexpected news sets world progress back a bit.
Past performance of investments is not a very reliable indicator of future performance. Indices and ETFs representing asset classes are unmanaged and not recommendations for any specific investment. Foreign investing involves currency and political risk and foreign-country instability. Bonds offer a fixed rate of return while stocks fluctuate. Estimated bottom-up S&P 500 earnings per share as of June 25, 2015 was $119.06 for 2014 and $133.74 for 2016. Sources: Yardeni Research, Inc. and Thomson Reuters I/B/E/S survey of consensus estimates. Standard and Poor's for index price data through July 2, 2015; and actual earnings data through December 31, 2014.
This website uses cookies for navigation, content delivery and other functions. By using our website you agree that we can place cookies on your device. I understand